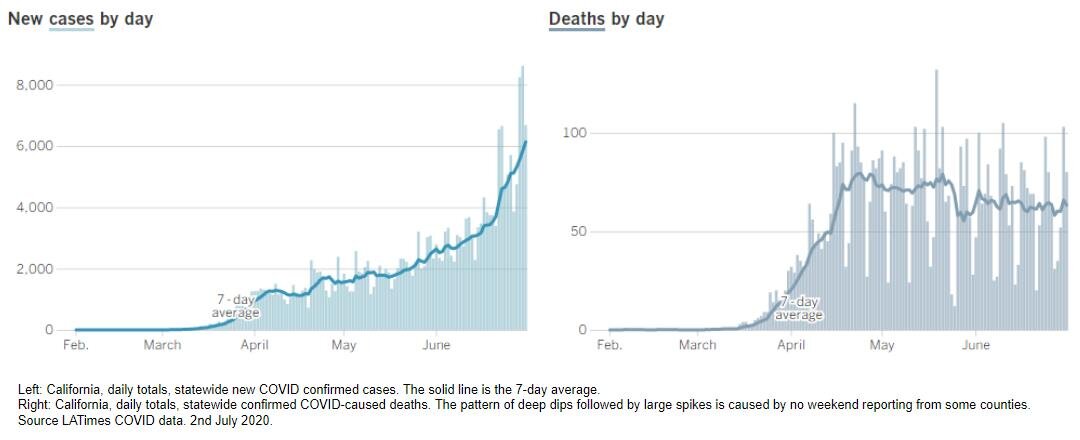
COVID o no no no no no

75 new cases in county, excluding SQ (52 new in San Rafael, 15 in Novato). Sausalito rose to 24 (+1); Marin City now at 11.
3 new deaths. 35 hospitalized!

SQ data remains a bit erratic. Total now 1,507

Graph compares 7-day average cases per million for Marin, SF, the 9 Bay Area Counties, LA county and the entirety of California. Thus: Marin County, excluding SQ, is now averaging about 43 cases per day on a population of 1/4 million: so that puts Marin at about 170 / million / day. Remember the good old days, in May, when our case rate / million was 1/2 that of SF? We're now more than double theirs.

I'm not quite sure how to judge the Calif totals: LA county has 1/4 of the entire state's population and it + the Bay Area are both below the state average.

Sources: Marin HHS, LA Times, LA County, SFIst.

107321116_10223057889896257_8160393079067849340_n.jpg

COVID new normal

Marin County counts seemed rather unreliable over and immediately after the 4th July holiday weekend, so I’ve omitted them here.

Marin County general population: 306 tested, 29 new cases. 31 now hospitalized - up 3, a new record high. 1 new death.

San Quentin: total shown today is 1,369 which is 9 lower than yesterday. SQ only logs active current cases, so this could mean recovery or some inmates were moved out of SQ. HOWEVER: SFist reports that 6 SQ inmates have died, and the last time I checked this number was just 1.

Graph shown is the 7-day moving average for the 9 Bay Area counties. As you can see: Marin, in green, now has about 44 new cases / day, compared to 12 / day about 6 weeks ago. The most rapid acceleration seems to be Santa Clara, which was about 17/day then, and is now over 150 / day. San Francisco was at 40 per day, now is 60.
Sources: Marin HHS, SFist (with data "corrected" to subtract SQ data from the Marin total). Marin data assumed accurate from 5th July (hospitalizations) or 6th (cases and fatalities).

COVID grind

Marin county (* see note): 1,038 tests, 52 (!!!!!) cases - mostly in San Rafael (44) or Novato (7). One new death reported, the county's 19th. Hospitalizations remain at 23.

San Quentin: 53 new cases - SQ prison has about as many cumulative cases and new daily cases confirmed as the entire Marin general population.

Statewide - accelerating case counts - spiking to over 8,000 on each of Monday and Tuesday of this week - having first exceeded 4,000 cases / day on 18th June. 6,682 yesterday. Really.

Statewide deaths, meanwhile, average about 60 per day, declining slowly. This *seems* consistent with the idea of COVID spreading in younger cohorts that then don't get as horribly sick. HOWEVER: the number of confirmed + suspected COVID cases hospitalized throughout the state has also risen significantly in the past two weeks, from about 4,500 to about 6,500.

Note: the Marin HHS geographic data has become somewhat inconsistent. I omitted "other" / rest of county, because the numbers wouldn't add up. Sorry.

Sources: Marin HHS, LA Times

106395735_10222993950017800_1214010147553530205_n.jpg
106569845_10222994199024025_4991782294956115854_o.jpg
106782439_10222994159583039_3749680021720128197_n.jpg

Who's getting it?

Marin general population, last 24 hours: 1,207 tests, 12 positive (* see note at end). A large increase in hospitalizations - I assume, but can't yet validate - that this is driven by transfers from San Quentin. There are now 23 hospitalized in county, up from 10 two days earlier. No deaths.

SQ reported 67 new cases, to a new total of 1,082 (up from 47 on the 18th June). The catastrophe there has attracted national attention - as it should.
---

Who gets COVID in Marin? The county HHS published cumulative statistics by age cohort, which I've reworked. It's interesting: the age mix has changed significantly over the four months of the pandemic here. In March: the over 65 age group had the highest number of positive tests. In June: the highest number was in the 19 to 34- year olds. Each month between shows a shift toward younger persons.

The two figures:
* The graph is 7-day averages by cohort (* see note)
* The table breaks down each month, and the bold outlined cells are where the majority of positive tests lie.

And, because tests have ramped up (nearly 31,000 as of today), it's the 19 to 34 year-olds with the highest number of cumulative tests, followed by the 35 to 49 year olds. (Hospitalizations and deaths are highly skewed to a much older set, of course.)

Note: the age demographic data AND the last 24 hour data from Marin HHS have anomalies. Example: the total listed for the past 24 hours is 12, but the Marin map update suggests at least 21. There are often lags in how data flows through.

83331093_10222971773183393_4025175083141465354_n.jpg

San Quentin Horror Show

For the general county - an easing in the number of positive cases: 1,005 tests, 29 positive - a particular drop in the number of new positive cases in San Rafael; 5 new cases in Southern Marin. Hope this trend continues!!

But the horror show in San Quentin worsens. Over 400 new cases, bringing the total there to over 1,015 confirmed cases, including over 100 staff. Deeply ill inmates now in hospitals in Marin, SF and Daly City. Marin County has appealed to Gov. Newsom for support. 42% of the state's prison-associated COVID cases are at SQ, up from 0 about five weeks ago. 

105752554_10222966674215922_4427440861544800342_n.jpg

The easing - at least for now - in Marin's general population is better than the picture in Alameda County: the 7-day average trends are depicted.

Sources: Marin HHS, Marin IJ, SFIst, California Department of Corrections and Rehabilitation.

The Marin county data have been worked to exclude SQ counts. All data accurate as of 30th June, morning.

105686639_10222966750937840_2787517541840304076_n.jpg

Still hot in Marin

Friday: 468 tests, 33 confirmed (7.2%!), no increase in hospitalizations, no deaths.

And 68 new active cases in San Quentin.

California state's estimate of R(t) for Marin county is 1.44, still the highest in California; several other counties also now have R(t) > 1.3.

Note: it's unclear - but seems likely - that the high R(t) estimate for Marin is in part a consequence of including the SQ data with the general Marin data.
Sources: Marin hhs, state picture from https://calcat.covid19.ca.gov/

106217693_10222953119797070_7181358645736811622_n.jpg
105622877_10222953106196730_8906480318616411299_n.jpg

Marin R rating ...

COVID projected. (This note was originally posted on Facebook on 25th June; it’s been updated since.)
The state of California launched a site yesterday with projections of COVID by county. Disappointing, but not surprising: Marin has a high R rating - 1.4, the highest in California. (The other county shown in red in the map below is Merced, with R ~ 1.3.)
I assume this model is skewed by the presence of the awful outbreak at San Quentin, but it's a sobering moment.
The state’s site now estimates R(eff) at 1.07; rt.live is currently projecting California with an aggregate R(t) of 1.09. Covid-projections.com says 1.1.


https://calcat.covid19.ca.gov/cacovidmodels/

105703341_10222919331712389_8376125065266796080_n.jpg

Marin trouble

24 hours - 54 positive cases (on 933 tests, perhaps), 13 total in hospitals (3 in ICU). No deaths.

(48 of the past two days' 84 or so new cases in Marin have been in San Rafael; 17 in Novato; the Marin HHS map data isn't updating smoothly. None new in Sausalito or Mill Valley.)

AND the current active cases in San Quentin rose to 505 (an increase of ~140 in 48 hours).

A simple graphical representation of average new case rates per million comparing Marin County (excluding SQ!), the total for the nine Bay Area counties, Los Angeles County and the entirety of California. Case rates are 7-day averages of new confirmed cases as number per million people.

Sources: Marin HHS; SFist (BA9C); LA Times data base and LA County HHS.

I replace the Marin county totals in SFIst with the Marin HHS numbers, to subtract SQ.

BA9C = Napa, Sonoma, Solano, Marin, Contra Costa, San Mateo, San Francisco, Santa Clara, Alameda.

COVID Surge 1

Marin - about 400 tests; 30 positive; 1 new hospitalization; no deaths. The county did not update the geographic info.

Separately: San Quentin total active cases now 456 (up 91)

A few weeks back, Marin had among the lowest case counts as a fraction of population (see note below) of the Bay Area counties. Now, mostly because of the hotspot in San Rafael, it has the highest.

Case counts here are: 7 day average new cases as a fraction of population. So, Marin's recent average of 27 cases per day vs its population of 251k = 109 / million people / day. And this excludes the outbreak at SQ prison.

Sources: SFist .csv files, from which I subtracted by hand the San Quentin active case data.

COVID: Right here / Right now

33 new cases in Marin in yesterday's report. San Rafael has recorded 85 in the past 4 or 5 days; Novato, 40; Sausalito, 2; Ross Valley area, 3; "rest of Marin", 20.

But the terrible story is the uncontrolled outbreak at San Quentin prison, where at least 350 persons - inmates and staff - have tested positive.

Jared Huffman, our Congress rep, wrote earlier today: "Tragic incompetence by prison health officials. In one month, San Quentin has gone from 0 COVID cases to over 350 prisoners and staff. All because of a single transfer of prisoners from Chino who had not been tested -- despite San Quentin staff being told they had tested negative. At this point, there are no good options and there may be no way to prevent the infection of everyone who lives and works at the prison. The Governor and state legislature must immediately investigate how this happened and make sure those responsible are held accountable." (Quote from Huffman post to Facebook; see also the SF Chronicle article here.)

The MarinIJ notes "Last week, 43 cases were found among the staff at Marin Sanitary Service after public health workers tested all 288 employees at the San Rafael-based waste management company."

Tiny note: Marin HHS data release has shifted later in each day and is now at or after 5pm.

I use "Ross Valley" to include: Corte Madera, Greenbrae, Kentfield, Ross, (Kent Woodlands) and San Anselmo.

106097660_10222894461570651_3182522731470013618_n.jpg

COVID in Marin / note on Mask Maths

COVID in Marin

In the ~three days since the last Marin HHS update: 2,452 tests, about 100 new cases, including 42 confirmed yesterday (PLUS 150 in San Quentin). No hospitalizations or deaths.
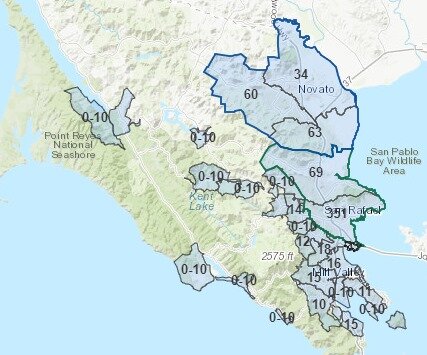
The new cases outside SQ - 63 in San Rafael; 22 in Novato; 1 in Sausalito; 2 in Ross Valley area. About 12 in other Marin County (not specified).
---

Mask Maths
A note on the effectiveness of wearing masks (thanks to Vanda Marlow for some notes on this, and a link to the research I quote!)

COVID is an airborne, respiratory pathogen. The principal vector is from via disease-carrying droplets expelled from the respiratory system of the infected person, via the air, into the respiratory system of the unlucky recipient. Droplets expelled by coughing, sneezing, wheezing, singing, shouting, talking, breathing.

Masks should work, then, right?

Here's Larry Brilliant, epidemiologist of some note and Mill Valley resident: "Marin is nowhere near out of the woods,” but ... “If 80% of people wore a mask 80% of the time, COVID would go away." Is that really true?

Really. Yes. They're easy and inexpensive, and the life you save may be your own. So in this post I want to note the science of how good they (and their wearers) have to be.

The science of how good masks need to be is well understood. The droplets start out (leaving the mouth or nose) in sizes from low tens of microns to low hundreds of microns. They shrink - due to evaporation - but then stay airborne, with smaller droplets staying in the air longer. So the first lesson is: since they're bigger as they're exhaled, it's critical that the infected person has something to block droplets. But, as we all know: there's a long period during which a person is infected and contagious - but doesn't have symptoms. And decent cloth is really good at blocking droplets. Masks are pretty good at blocking inhaled droplets as well - but they don't have to be that good there.

These ideas give mathematicians enough to get cracking on modelling. It's hard work but the basic idea is to answer the question: what level of face mask adoption by the public, associated with what level of face mask efficacy, would be required to reduce the effective reproduction number (R) below 1? And the answer is ... indeed, Brilliant is right. If nearly everyone wore reasonably effective masks nearly all the time ... COVID goes away.

The graphs attached show modelling (Oxford University group, Stutt et al, published a week or so back) that tries to show effectiveness at quashing transmission of COVID given lots of variables: the effectiveness of the mask - the graphs reading from left to right represent increasing effectiveness; the R(0) of COVID - the blue lines are the higher R(0) estimate; whether the masks are only worn after symptoms are determined (top rank) or all the time (bottom rank); and what percentage of people wear masks - each graph, from nobody to everyone. Each of the eight little graphs shows the effective R (written as R/e) in each case. The goal: R needs to get below 1.0.

OK, what to do?
First - compare the two rows. Wearing masks only after symptoms never does enough to spread contagion for R(0) = 4.0. Never.
Then look at the bottom row, the 3rd column - 75% mask effectiveness. Everyone, or nearly everyone, wearing reasonably effective masks, all the time ( = outside your household) kills the spread of COVID.

The message: Don't wait for someone to have symptoms. Always wear masks. Limit your exposure to unknown places and people.

Ill update this note with llinks to the research I cite here and some other sources, plus some of the data on lives saved or lost by wearing them, or not; share an anecdotal note on life in Asia.

105616411_10222884636205023_5029969093780933199_o.jpg

COVID: R-rated

24 hours in Marin: 844 tests, 18 new confirmed cases (10 in San Rafael; 7 in Novato; 1 in Ross Valley towns), plus one in San Quentin. 0 new hospitalizations; 0 deaths

The infectious spread of a disease, like COVID, is measured by R, the infection rate. At its heart, the idea of R is very simple. R is the number of people that an infected person will get infected. When a disease first shows up, as COVID did a half-year ago, there’s no immunity, no vaccine, nothing. R then is called: R(0), pronounced R naught. R(0) for COVID was about 5 or 6 - each infected person would transmit the disease to five or more people. (Typically for season ‘flu it’s between 1 and 2; measles is scary - R(0) of 15 or higher!) This high R(0) is why the COVID initial statistics showed a 25% increase in infected people PER DAY!!!
As the contagion progresses, R drops and is replaced by R(t) … t stands for time. Why does it drop? Two major reasons, in the absence of vaccines, etc: First, if a significant number of the people in a crowd already have it (and if they cannot be re-infected), then the infected person can’t spread it to them. Second, because the people in the crowd, hopefully, can take precautions to prevent infection. (Widespread use of vaccines are incredibly powerful at limiting R, but who knows when one will be safe and effective for COVID?)
If R stays significantly above 1, it’s spreading. If it drops to 1 - each infected person only transmits the disease to one other person - and the contagion stays but doesn’t grow. If it drops below 1, the disease is on its way to extinction.

So, where is R now?

  • Marin County: Perhaps 1.2

    • Dr. Matt Willis, the county’s director of pubic health, used this estimate about 10 days ago in one of his presentations. I don’t have data to back this up or negate it. He also said that Marin had the 4th highest R in the state.

  • California: About 1.1

    • I’m not aware of a statement from the state of its R(t), so am relying on external sources. The two I like best are rt.live (run by one of the founders of Instagram) and covid19-projections (run by a machine learning grad student at MIT). rt.live is currently offline as its model is being rebuilt, but was showing - implausibly - R(t) of 0.98 yesterday. covid19-projections is currently showing California with R9t) of 1.1.

104439856_10222854592453948_6207130130973430908_o.jpg

R is not trivial to calculate. There are a variety of entities - those I mention here, plus Imperial College, Johns Hopkins and others - that have published their tools (and at least one of them runs beautifully on my PC!) And just about everywhere is publishing the raw data on COVID in computer-readable form (when I refer to sources as .csv format, that’s comma-separated variables, a form used for transferring data for computers - the Los Angeles times and NYTimes maintain data repositories for this purpose). But I’m relying instead on entities with better tools and better capabilities than my own.

COVID - about the Marin spikes

COVID good news / bad news

Marin: 24 new cases, no deaths, no new hospitalizations.

---

I had planned to post about R, the mathematics of contagion, today. And then perhaps to the maths of using masks. But then ... I was asked if the spike in Marin county's COVID count was associated with the hotspot at San Quentin. The questioner noted (I'd mentioned this before as well) that about 100 prisoners had transferred up from Chino prison, bringing COVID with them.)

And the answer seems to be: no. Their spike adds to ours. It took rather longer to get this debugged than I'd hoped. But my best interpretation of recent town-by-town analyses for Marin for the past 10 days is shown in the table.

104752194_10222847230309899_8329495433381965439_o.jpg

The analysis includes:

  • The LA Times data for 17th June adds to 842 for yesterday, precisely consistent with separating Marin's spike from SQ's.

  • Marin HHS uses language that is reasonably clear about excluding San Quentin.

  • The day-to-day changes in the Marin county totals are not consistent with the known changes in the San Quentin totals.
    HOWEVER the numbers for 8th and 9th June, before San Quentin date were added, don't add to 625, the known-countywide total for that date.

. Thanks for the question!

---

Testing in Marin County seems to be nearing 9% of the entire county. About 4% of Marin County tests are positive, which is slightly below average for the state. Nearly 3 million of the whole state's 39.5 million inhabitants (7.6%) have been tested, about 5% positive.

New cases throughout California continue to climb - over 4,000 yesterday, a new, bad record; deaths remain steady, at about 70 / day.

Sources for Marin data: Marin HHS and the Internet Archive's Wayback Machine to review some historic screen grabs of the Marin HHS website maps.

LATimes for statewide counts and fatalities.

104672791_10222846800099144_8083334523945145926_o.jpg

COVID gulp

47 new cases. 1 death.

No new hospitalizations.

Details are a bit unclear but over the past two or so days, there seem to have been at least 59 cases in San Rafael. (The map boundaries posted by Marin HHS have changed.) The picture in southern Marin - Corte Madera, Mill Valley, Sausalito, etc., - seems unchanged, with zero new cases in the past 5 or so days. The spike in cases puts Marin in a bad position. I calculated how the new cases work out on a per-population basis, and compared Marin with Sonoma Counties, SF, the whole Bay Area (9 counties), Los Angeles County and the entirety of California.

Marin County now is seeing MORE cases (as a fraction of the population) than is average across California, and more than twice the average for the Bay Area. Sources: Marin HHS, SFist (for the Bay Area counties; their data is not 100% congruent with Marin's, so I manually reworked); LA Times and LA County. Data current through yesterday.

---

Tomorrow, update on Marin, plus (I hope) discussion of the simple but important mathematics used to calculate infectious rates. Then, following a question from a neighbor / friend / reader, the maths of using masks. Your questions are welcomed.

102886002_10222837490386407_7882566771298652398_n.jpg
104492539_10222837517507085_5969102909977330140_n.jpg

TinyCOVIDupdate

11 new cases in Marin*:

6 in San Rafael

2 in Novato

1 in San Anselmo

2 - location not given

Additionally, Marin has started reporting (separately) the San Quentin data: 26 cases there.

* ... Marin is releasing data later in the day, so this is based on yesterday's data. Source for these: Marin HHS.

Next few days: I'll look at case density (confirmed cases as % of population) for Marin and other counties, and - separately - R(t), the mathematics of contagion. Unless someone has questions / preferences.

COVID hotspots

66 new cases in the three days Friday to Sunday. That's a 10% increase in the total cases in the three-plus month history of the pandemic in Marin County. Ouch. What's going on?

The answer seems to revolve around a hotspot in the Canal district in San Rafael (which city has seen 72 more cases, on a base of 265 in the past ~10 days) and perhaps another in Novato (32 on a base of 113). There's a hotspot also in San Quentin prison, but numbers there aren't counted in the county totals.

That's being met with accelerated testing in San Rafael / Canal and in Novato - and with more contact tracing (at least 38 people hired for that, with an emphasis on bilingual / bicultural skills).

Neither Sausalito proper nor Mill Valley have had new cases in the past ~10 days.

9 now in Marin hospitals (reached 10 on Saturday); no deaths.

Sources for today; Marin HHS website and data presentation of Dr. Willis, head of Marin HHS last week to county supervisors.

104217530_10222818007379344_7347735755399630673_n.jpg

COVID the week

(Originally posted on 12th June 2020)

  • 13 new COVID cases in Marin, bringing the average for the past 7 days to ~14 per day

  • More testing ... on Tuesday, for the first time, over 1,000 tests in a single day. Average is now ~700 per day.

  • There are now 8 in hospital - it's been this high before, in early April; 3 remain in ICU.

The 7-day average of new cases in Marin shows a steady climb (see graph below).

---

Also, I wondered about the high fatality rate in older folks as I depicted in the immediately prior post, and specifically: how many of them were in nursing homes (which governments call Skilled Nursing Facilities).

The answer is: 47% of California's entire older cohort deaths occurred in SNFs, with a simple case fatality rate of 18.8%. Californians over 65 not resident in SNFs have a simple case fatality rate of 13.4%

(6,584 health care workers in SNFs have tested positive and 67 of them have died.)

11% of SNF residents have tested positive, versus ... wait for it ... only 0.23% of non-SNF-resident Californians over the age of 65. Which is lower than the 0.34% of all Californians who have tested positive (137k / 39.58 million).

Conclusions: the easy one is that SNFs / nursing homes are dangerous places in a contagion. The harder one is about case fatality outside SNFs. I'd imagine that the super-low % that have tested positive is because they're doing rather better at sequestering themselves and aren't in the worried-well category of the tested. But that's at least in part projection.

My "simple case fatality rate" estimate = number of fatalities in cohort divided by the number of positive tests in that cohort.

I made a simplifying assumption - that every SNF resident is over 65.

Sources: Marin hhs; Kaiser Family Foundation and Calif department of public health for data on SNFs; LA Times for aggregate statewide case and fatality data.

102678225_10222787682061230_8939464487347275869_n.jpg
104001806_10222787833825024_4612880688701158272_n.jpg

COVID and grim

1. Marin cases - 15 in past 24 hours. (Marin HHS revised downward the number for ~Monday to 22, so there are 46 cases in the past three days)

The number in hospital is now 6 including 3 in ICU. (Those were 2 and 0, respectively, 24 hours ago).

About 630 tests per day across the county.

---

2. Across the state, daily case numbers continue to climb - it'll soon be commonplace to have 3,000 new case confirmations per day.

COVID deaths aren't rising as much, perhaps, with about 70 per day. (The State compiled data have a weekly pattern that reflects that some counties don't send in data over the weekend.)

---

3. Fatalities are heavily skewed toward older patients. The full data on COVID, state-wide, across the several months of COVID here show a rough Case Fatality Rate of 3.5% - that's the percentage of people who have died from it divided by the number of confirmed cases. But ... the cases tend to be of younger people - while this simple CFR estimate is a stunning 15.9% for the age cohort of 65 years old and above. Meaning: roughly 1/6 of those in that age group who get COVID die from it. (There are some ambiguities in my language that reflect ambiguities in the consequences, but these are solid estimates.)
---
Tomorrow, I'll look at Marin HHS and Larry Brilliant recent assessments of COVID projections.
---

Data sources: Marin HHS, the LA Times data project and the State COVID data project.

102412048_10222776983393770_8023893001000289513_o.jpg
103591660_10222777008554399_5693345568074027263_n.jpg

COVID datadatadata

Post from 10th June, 2020

1. Marin County. Only 9 new cases in past 24 hours (but there's some inconsistency in the .hhs data I haven't debugged). 2 in hospital (ICU!). No deaths.
2. SF averaging 27 new cases / day, no recent deaths.
3. Three new graphs:
a. 7 day averages (new cases/day) for Marin and SF
b. SF and the whole Bay Area (9 counties)
c. Whole Bay Area and entire state
Bottom line -
Steadily climbing new case counts everywhere (against a background, for the most part, of adequate hospital resources).
Sources: Marin hhs, SFist (SF and local counties), LA Times github repository. SF and Marin data are current; statewide believed current to 8th June.

102777485_10222766145762836_269073555770882788_n.jpg
103118113_10222766150522955_7680752626720088683_n.jpg
102104550_10222766156963116_8891516718355203571_n.jpg

COVID here, part 2: Buckle up ...

Marin county recorded 36 new cases in the past 24 hours. That's nearly twice the previous maximum.

Marin HHS published a table of COVID cases / 100k residents, and it's ... interesting. Sausalito is much higher on that count than I'd have hoped. (Our part of the world - unincorporated Sausalito / Marin City - has too few people and cases to get meaningful data, and the county doesn't release data for areas with fewer than 10 cases, arguing that it erodes privacy.).

---

And statewide case numbers continue to climb, now averaging nearly 3,000 per day.

Sources: Marin HHS and LATimes

101969843_10222756759328181_665530201189086840_n.jpg
103132519_10222756789208928_1539985849259343492_n.jpg